
A food manufacturing company with a portfolio of 300 SKUs faced a critical paradox: historically high inventory levels occurring simultaneously with recurring cash flow tensions.
Traditional analysis (ABC by revenue) suggested that stock was “under control.” However, the financial reality told a different story. The executive team needed to answer a decisive question: How much of our cash is actually “sleeping” in the warehouse, and what is the opportunity cost?
Instead of viewing inventory as a static accounting figure, we deployed a Business Intelligence framework that synchronizes two vital operational dimensions:
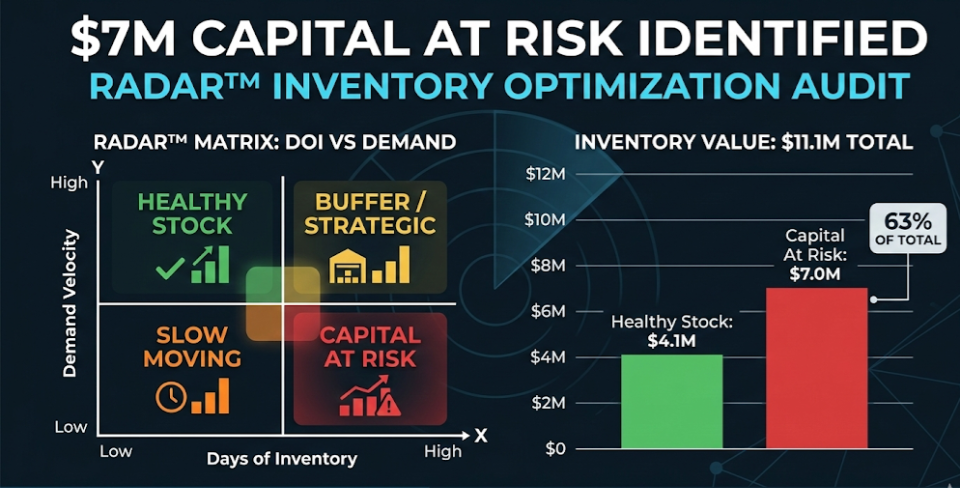
By integrating these variables into our RADARâ„¢ environment, we achieved an automated segmentation that isolates “Healthy Stock” from “Capital at Risk.” This goes beyond what any standard ERP can visualize.
Through RADARâ„¢ Scan, the system exposed a figure hidden by traditional spreadsheets: out of a total inventory of $11M, $7M (63%) was identified as Capital at Risk (Inmobilized).
This level of granular visibility allowed the Procurement Department to halt unnecessary orders instantly. Managers were able to navigate from the $7M global leak down to the specific SKU level in just three clicks.
The system pinpointed exactly which high-inventory products required immediate action—be it promotional liquidation, supply recalibration, or strategic write-offs—to clean the warehouse and restore the balance sheet.
Business Intelligence is not about “viewing the past”; it’s about commanding the future of your cash flow. In this case, the use of dynamic matrices allowed the organization to transform a storage liability into a reinvestment opportunity.
Ready to unlock your trapped cash flow?
Don’t let your working capital sleep in the warehouse. Activate your RADAR™ Scan EBITDA Recovery Audit today and identify exactly where your liquidity is hiding.
Click here to Start your RADARâ„¢ Scan
Not ready for a scan? Join our newsletter